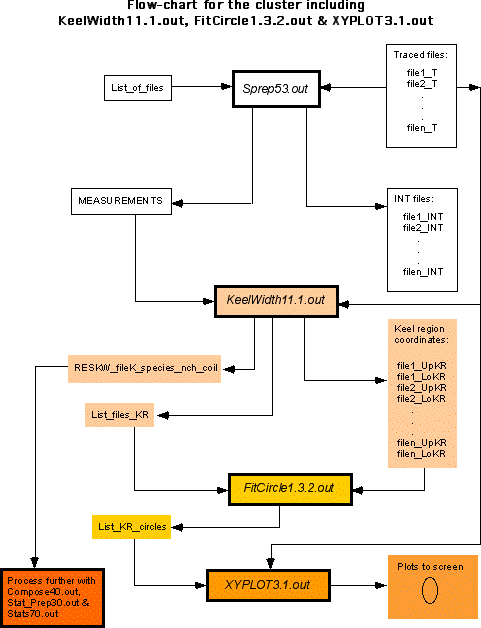
- Figure 5c: Flow-chart illustrating the sequence programs
KeelWidth11.1.out, FitCircle1.3.2.out and XYPLOT3.1.out and their
input files. Boxes with thick frames indicate applications. Boxes
with thin or no frames indicate generated data files. Each color
indicates the application and the data, that are produced by
this program. Connecting lines indicate data flow. The colored
program versions form Cluster A and are compatible to
collaborate with each other (i.e. KeelWidth11.1.out, FitCircle1.3.2.out,
XYPLOT3.1.out, Compose40.out, Stat_Prep30.out and Stats70.out).
Click into the figure to open a printable pdf version of this
figure.
